The True Cost of a Direct Hotel Booking
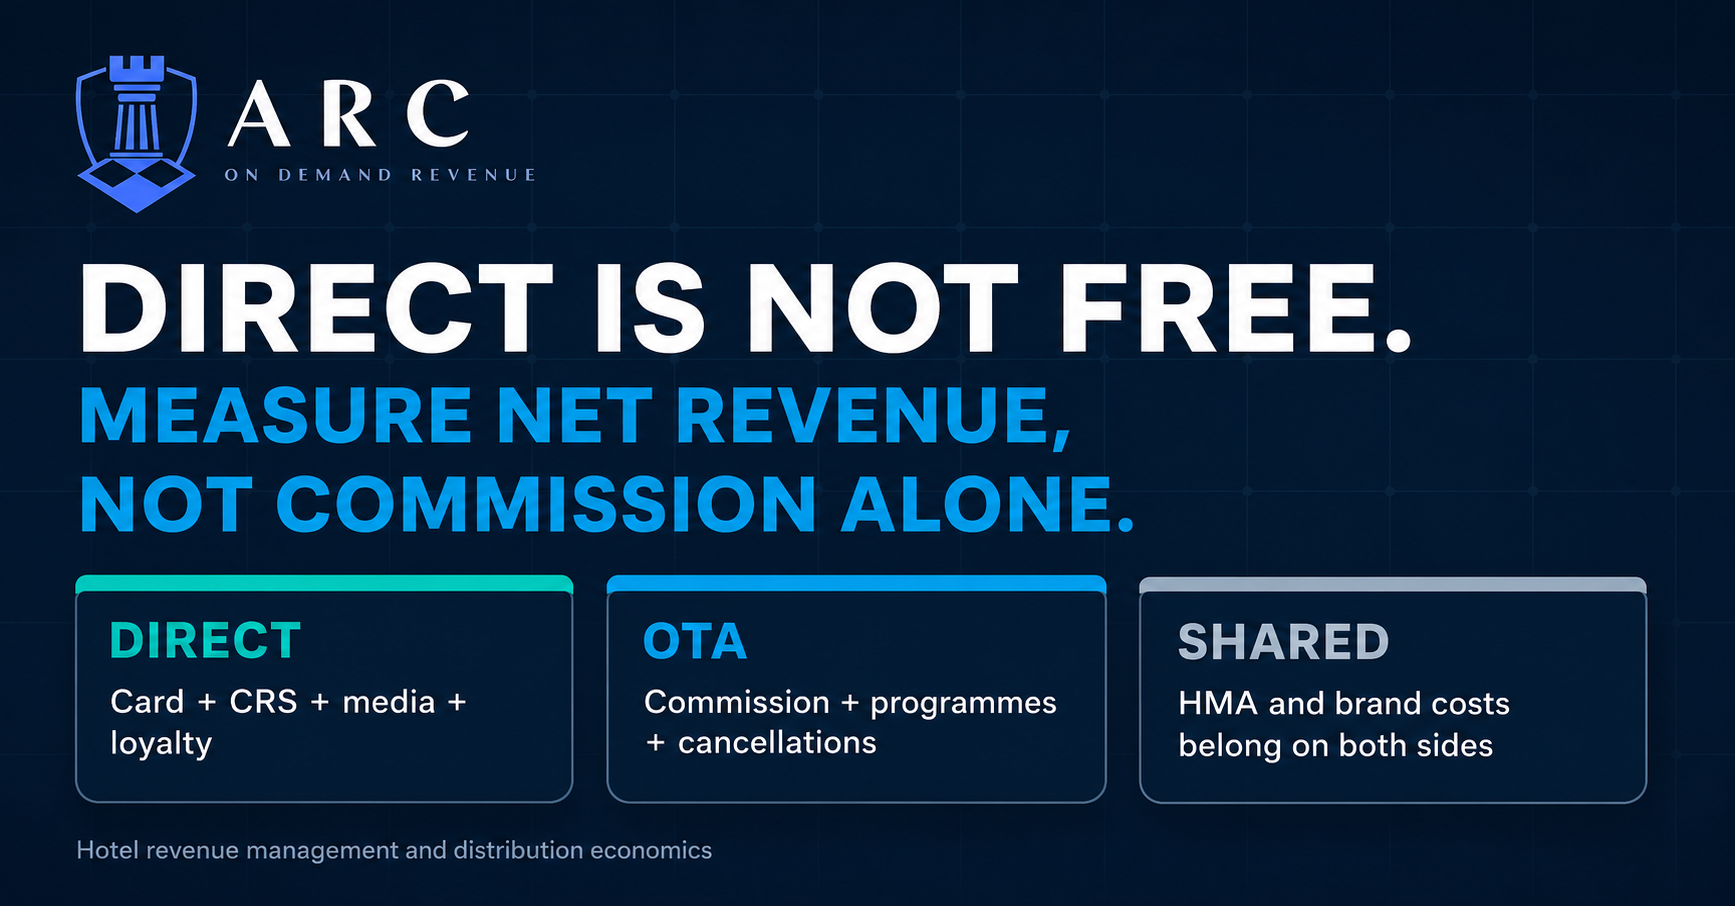
What the channel cost comparison reports don't show you
Ask any revenue manager whether direct bookings are more profitable than OTA bookings and the answer will almost always be yes. The commission saving is real. The cancellation rate differential is real. The guest data ownership argument is real.
But the standard direct vs OTA cost comparison used across most of the industry has a significant blind spot: it was built for independent hotels. Apply it to a branded managed hotel and the numbers look very different, and the saving you thought was 18% turns out to be considerably smaller.
The Standard Model and Why It's Incomplete
The commonly cited direct booking cost of sale runs 3%–7% of room revenue, covering booking engine fees, payment processing, website costs, and metasearch. Against an OTA commission of 15%–25%, the saving is obvious.
For an independent hotel, this is a straightforward calculation. For a branded managed hotel, this model is missing the majority of the actual cost stack.
The other mistake runs in the opposite direction: some channel analyses load base management fees, incentive fees, PMS charges, and brand assessments onto the direct booking column while excluding the same costs from the OTA column. That is not an apples-to-apples comparison either.
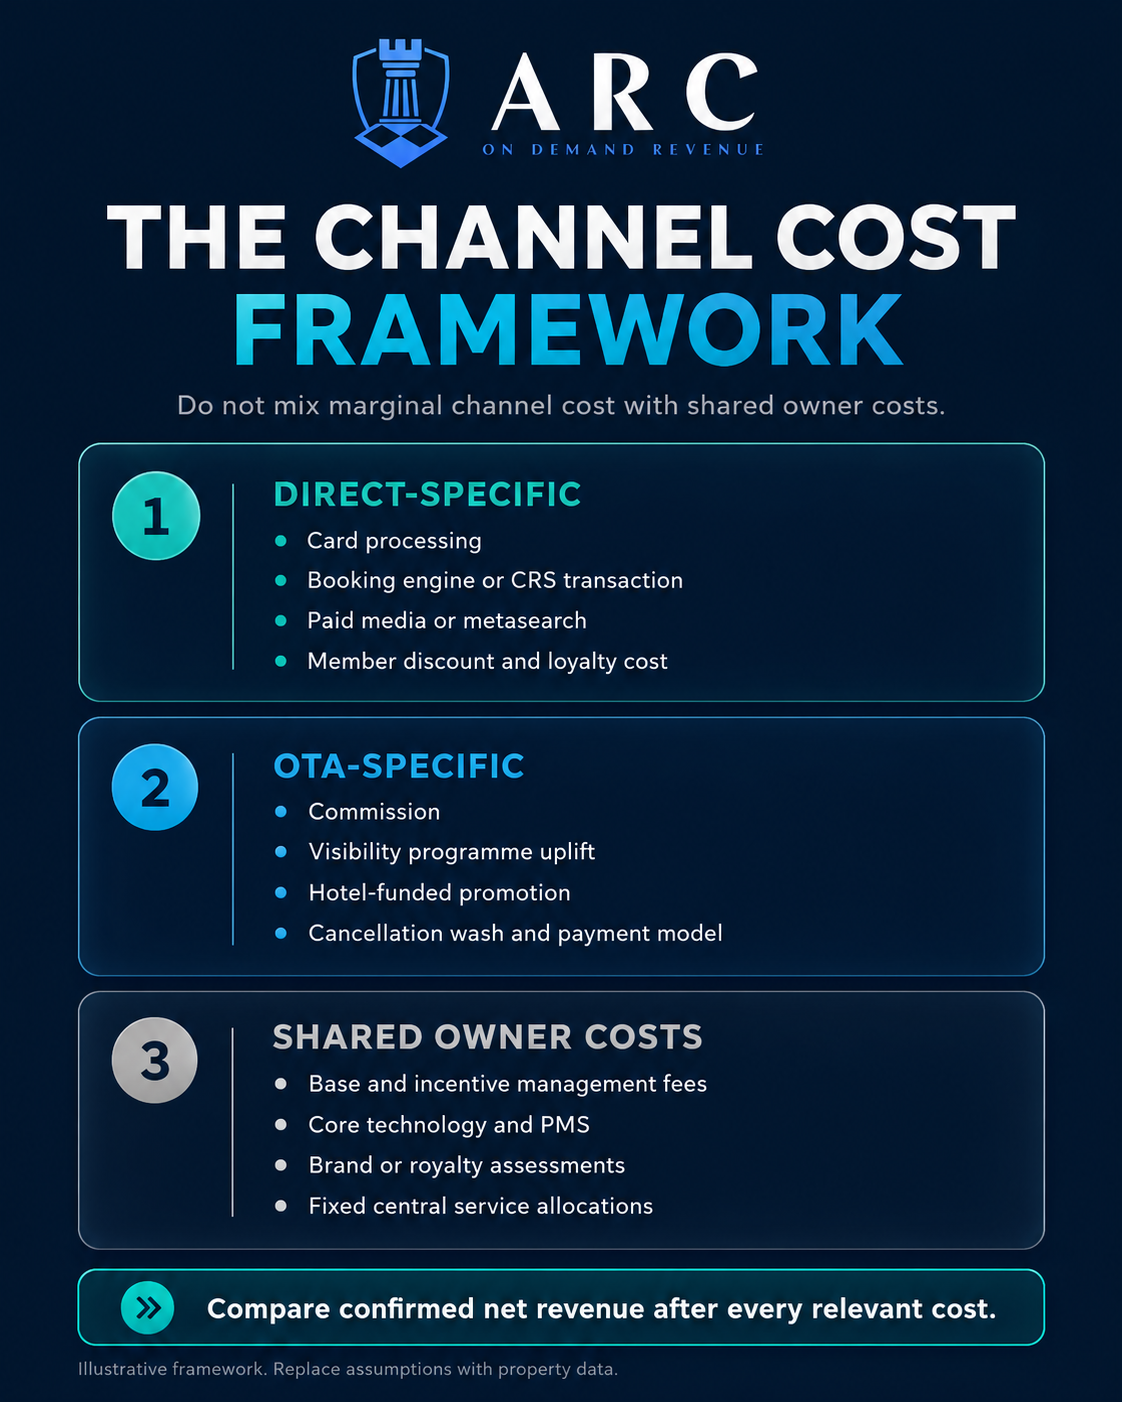
The correct approach separates costs into three distinct buckets.
The Three Cost Buckets
Bucket 1: Direct-specific costs
These are costs caused or materially changed by a direct booking:
- Card processing where the hotel is merchant of record
- Booking engine or CRS transaction charges
- Paid search, metasearch and affiliate costs
- Loyalty programme assessment on member stays
- Member-only rate discount
- Elite tier benefits funded by the hotel: breakfast, lounge access, upgrades, compensation points
Not every direct booking carries every cost. An organic, non-member direct booking may be very inexpensive. A paid-search loyalty booking through a brand platform is considerably more expensive.
Bucket 2: OTA-specific costs
These are costs triggered by the OTA booking:
- Base commission (typically 15%–18% on Booking.com for standard hotels in Southeast Asia)
- Visibility programme uplift: Preferred and Preferred Plus participation involves additional commission; check your extranet for your property's specific rate
- Genius discount: 10%–20% off selected stays, funded by the hotel
- Payment or virtual-card processing depending on the collection model
- Higher cancellation wash
Bucket 3: Shared owner costs
These reduce owner cash flow but do not change because the guest booked through a different channel:
- Base management fee: 2%–4% of gross revenue
- Incentive management fee: 5%–15% of GOP
- Brand marketing fund contribution: 1.5%–3% of room revenue
- Fixed PMS and core technology charges
- Brand royalty or licence assessments: 1%–3% of room revenue
- Fixed central service and cluster allocations
These costs belong in the hotel P&L and HMA analysis. They should not be loaded onto one channel to make it look artificially expensive.
The Worked Example
Using a USD 150 (THB 5,250) room rate at a 150-room upscale branded hotel in Southeast Asia.
OTA booking; Booking.com standard 18% commission:
| Cost Item | USD | THB |
|---|---|---|
| OTA Commission (18%) | 27.00 | 945 |
| Payment processing (1.5%, hotel-collect) | 2.25 | 79 |
| Total channel cost | 29.25 | 1,024 |
| Net to owner before shared costs | 120.75 | 4,226 |
Direct booking; branded managed hotel:
| Cost Item | USD | THB |
|---|---|---|
| Card processing (2%) | 3.00 | 105 |
| CRS / reservation transaction | 8.00 | 280 |
| Loyalty assessment (2%) | 3.00 | 105 |
| Attributable paid media (3%) | 4.50 | 158 |
| Total channel cost | 18.50 | 648 |
| Net to owner before shared costs | 131.50 | 4,603 |
Direct wins by USD 10.75 (THB 377) per room per night in this example, not USD 27. Not 18 percentage points. The shared costs in Bucket 3 sit on top of both figures equally and do not change the channel comparison.
If the direct booking includes elite amenity costs, a member rate discount below USD 150, or loyalty redemption displacement, the advantage narrows further. If the booking is organic and non-member, the advantage widens. The answer is property-specific. Use your actual contract, extranet, and payment data, not industry averages.
Cancellation Wash: Always Material, Rarely Modelled
One factor that shifts the channel comparison significantly is cancellation rate. Cloudbeds 2026 data shows OTA bookings cancel at 21.8% versus 10.6% for direct bookings. D-EDGE's 2024 report, based on nearly 5,000 hotels in Europe and Asia, found over 40% of Booking.com revenue cancelled, with 42% in Europe.
In practice this means: to generate the same confirmed room nights, an OTA channel needs materially more gross pickup than a direct channel. The revenue manager who compares only net rate per booking and ignores cancellation wash is understating the true OTA cost.
The counterpoint worth noting: loyalty member bookings on flexible rate plans, particularly elite tiers, can also carry elevated cancellation rates. A member booking a discounted flexible rate who cancels close-in creates a different kind of revenue leakage. Cancellation behaviour needs to be measured by channel, rate plan, and booking window at your property, not borrowed from industry benchmarks.
The metric that matters is confirmed net revenue: realised room revenue after channel-specific discounts, commissions, transaction charges, payment costs, attributable acquisition spend, loyalty cost, and expected cancellation wash.
Five Questions Every Revenue Manager Should Be Able to Answer
If you are building a channel strategy or presenting distribution recommendations to ownership or an asset manager, you should be able to answer these:
1. What is the all-in channel cost for each booking source?
Not commission percentage. Net revenue after every applicable channel-specific fee: loyalty, CRS, media, payment processing, by source.
2. What is confirmed net revenue per channel after cancellation wash?
Gross pickup minus cancellations, at the actual rate paid.
3. What is the loyalty channel delivering at property level?
Member room nights, ADR premium or discount versus non-member, redemption displacement, elite amenity cost per occupied room. Property-level data, not brand statistics.
4. Are OTA visibility programme costs justified by incremental volume?
Genius, Preferred, and Preferred Plus all carry costs funded by the hotel. A programme is only profitable if its incremental net contribution exceeds the cost and any displaced demand. Model it; don't assume it.
5. What does the brand's CRS fee structure look like by booking source?
Many CRS structures charge differently by source: brand.com, GDS, voice, loyalty app. Pushing volume into a higher-fee direct source is not channel optimisation; it is moving cost around.
The Bigger Picture
The direct vs OTA debate has been framed as a binary for too long. The reality for branded managed hotels is a spectrum of channel costs, all of which the owner ultimately bears.
Direct should win because the property-level economics prove it, not because the OTA commission was the only number anyone measured. In some markets and segments, leaning into OTA volume during low demand is the right call. In others, aggressively protecting direct is. In most cases it is a calibrated mix, reviewed monthly, with full cost transparency by channel.
The revenue manager's job is not to push direct because the brand says direct is better. It is to find the channel mix that maximises confirmed net revenue to the owner, after every fee, every commission, every loyalty obligation, and every cancellation.
That analysis starts with the real numbers.
ARCC Group provides outsourced hotel revenue management, distribution strategy and commercial performance support across Southeast Asia and Europe.
Related owner-side analysis
Companion owner-side analysis: Book Direct, But Who Captures the Value? – Signa Hotel Advisors
Sources
- Cloudbeds: 2026 State of Independent Hotels
- D-EDGE: Hotel Distribution Report 2024
- CBRE: Guest Loyalty Programs: Benefits and Costs Continue to Rise (2024)
- HVS: Hotel Management Fee structures
- JLL/Baker McKenzie: Asia Pacific HMA Survey 2024